 |
 |
 |
 |
 |
Previous samples are quite old now, but this doesn't mean that I'm no longer programming simple figures with MetaPost as one may see below.
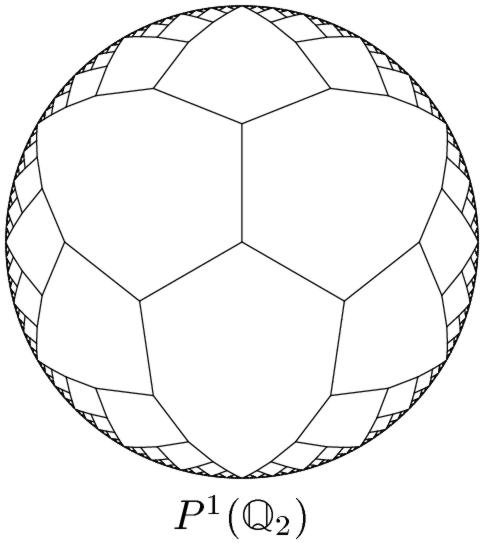
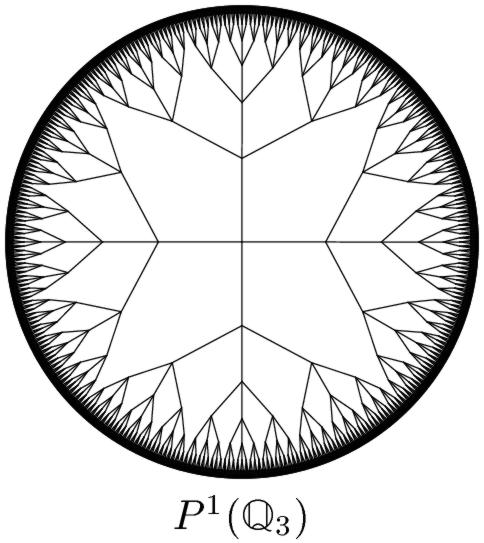
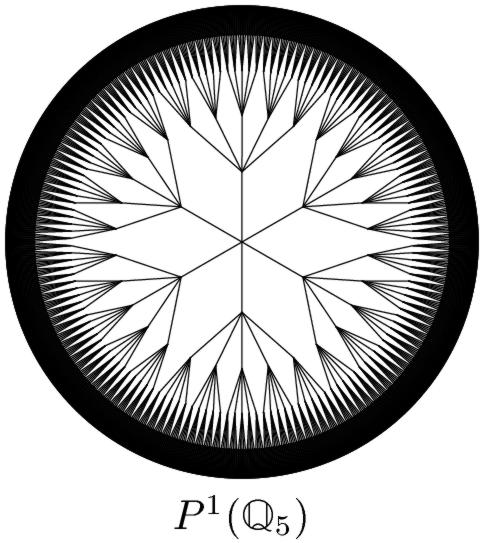
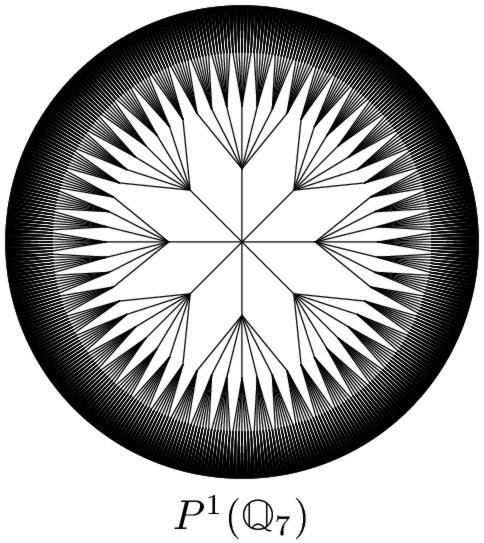
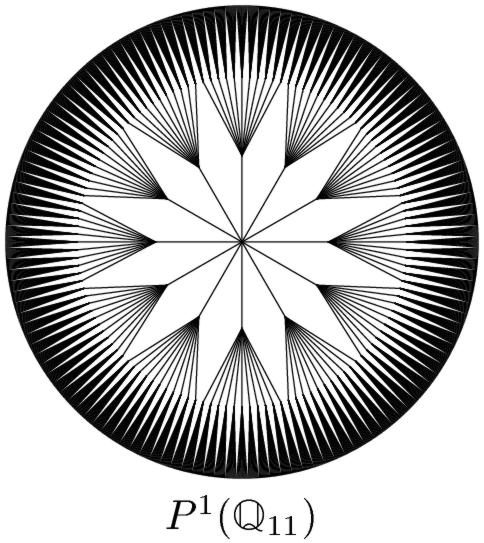
Paul Broussous and I had some discussions on mathematical graphics and tools for designing them. Once, he showed me how to have a visual perception of p-adic fields Qp (where p is some prime number): it may be represented thru some graphical representation of P1(Qp) which is this field compactified by a point at infinity, itself being the boundary of some infinite tree. A very simple metapost program (broussous.mp) could have done the job while hand drawing was not totally convincing.
|
|
|
|
|
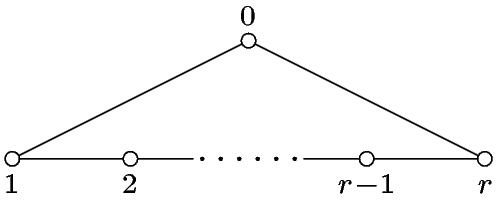
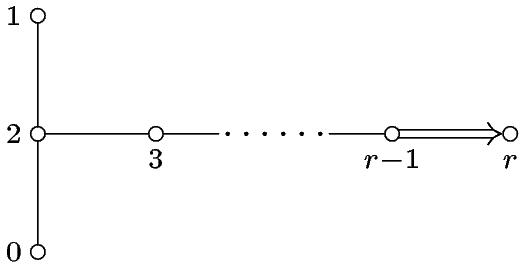
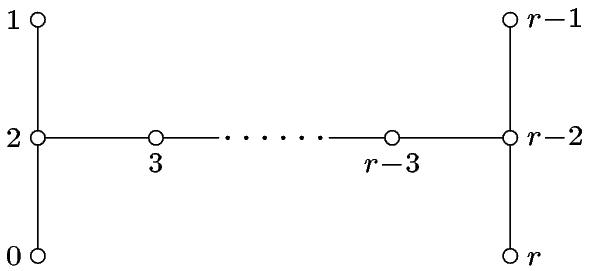
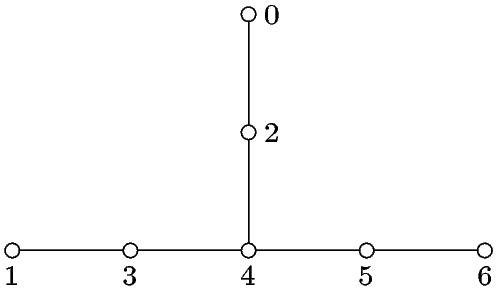
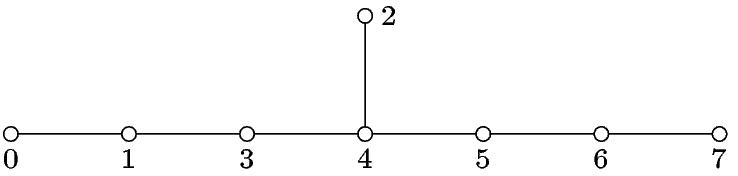
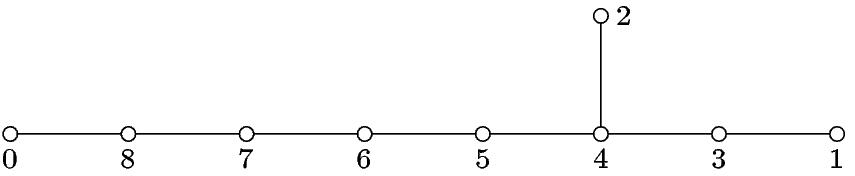
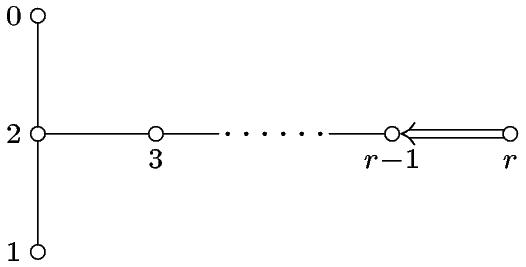
Pol Vanhaecke needed to draw some Dynkin diagrams for a forecoming book. Since I attempted to design such diagrams by the past, I told him that I would have fun making these. The main resulting program is dynkin.mp which is only an input file. Arrows, breadths, radii and spreads are intended to fit 10 points' Computer Modern. A sample file is vanhaeck.mp (see also vanhaeck.ps.gz) where one can remark that the syntax is not so far from imed.mp, it is just richer.
 |
 |
|
 |
 |
 |
 |
||
 |
||
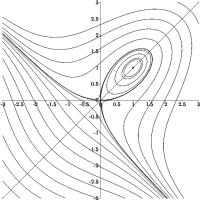
Drawing functions or parametrical curves in MetaPost is easy since many things are on the college level. What is more interesting is drawing implicit curves, i.e., curves defined by an equation like
(x, y) in R2 such that f(x, y)=c,
where f is a quite regular map from R2 into R. Strangely, numerical methods for solving such problems are never described anywhere. When I was a young student, I spent hours in finding some technics, and, once found, hours in making them into practice. Recently, Paul Broussous and I discussed of this kind of problems, so I felt like showing him some numerical solutions with MetaPost. The equation is
(x, y) in R2 such that x3 + y3 - 3xy =0
whose solutions form an elliptic curve. The program is implicit.mp and has been written late in a monday evening. Clicking on the image (which represents equipotential curves associated to the polynomial on the left-hand side of the equation) one would get a text written in french for an academic purpose.
 |
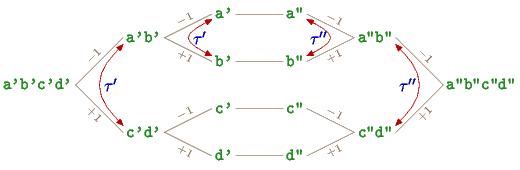
Stéphane Laurent works on some, step by step, finitely generated filtrations. This involves trees and examples, or counter-examples, are obtained with words valued processes. Designing trees by hands is a hard task. Doing it with MetaPost is quite easy and leads to high quality drawing as one can see (I hope) below. The program wordtree.mp has not reached its final state but it is yet, I think, ready for designing many such trees.
 |
Paul Broussous seems to share with me some kind of love for mathematical pictures (I hope we are not the only ones). Every time he attempts to draw a picture with some mathematical software I won't name (I know nothing about northern America trees), I try to do the same with my own tools (MetaPost of course). The last case is the following:
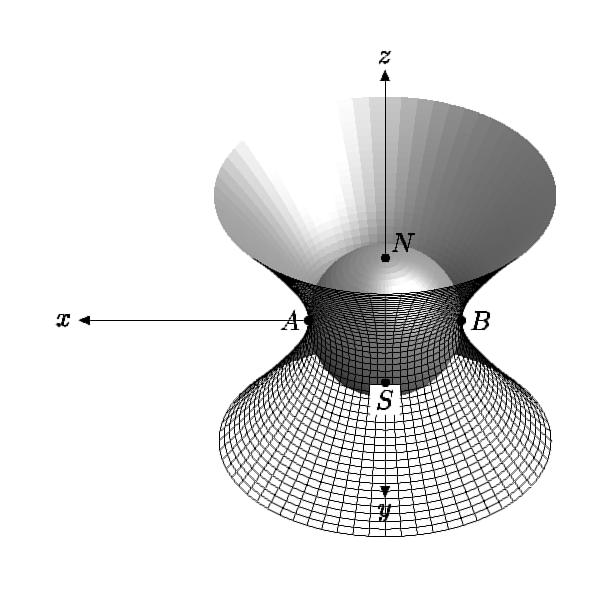 |
This picture has been created quite rapidly with my m3Dplain format:
input m3Dplain.mp;

ObjectColor:=0.75white;
Resolution:=1mm;
ProjectionSystem(linear);
unit:=1cm;

vardef blankdotlabel@#(expr t,loc) =
  save lab_; picture lab_;
  lab_=thelabel@#(t,loc);
  unfill bbox lab_;
  dotlabel@#(t,loc);
enddef;

beginfig(1);
  Euler(-45,0,0,1);
  path p;
  p=(sqrt5,2)..(sqrt2,1)..(1,0){down}..(sqrt2,-1)..(sqrt5,-2);
  Inside;
  UseObject(revolution,Origin,Origin,unit,p);
  Outside;
  UseObject(sphere,Origin,Origin,unit);
  def Fill(expr c, p, n) =
    if Orientation(c) >= 0:
      addto currentpicture doublepath c
      withpen rule.nib withcolor PenColor
    fi
  enddef;
  UseObject(revolution,Origin,Origin,unit,p);
  pickup rule.nib;
  drawarrow proj(unit,0,0)..proj(4unit,0,0);
  label.lft(btex $x$ etex,proj(4unit,0,0));
  drawarrow proj(0,unit,0)..proj(0,4unit,0);
  label.bot(btex $y$ etex,proj(0,4unit,0));
  drawarrow proj(0,0,unit)..proj(0,0,4unit);
  label.top(btex $z$ etex,proj(0,0,4unit));
  dotlabel.lft(btex $A$ etex, proj(unit,0,0));
  dotlabel.rt(btex $B$ etex, proj(-unit,0,0));
  dotlabel.urt(btex $N$ etex, proj(0,0,unit));
  blankdotlabel.bot(btex $S$ etex, proj(0,0,-unit));
endfig;

end.
Here is a much better version.
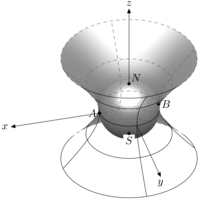 |
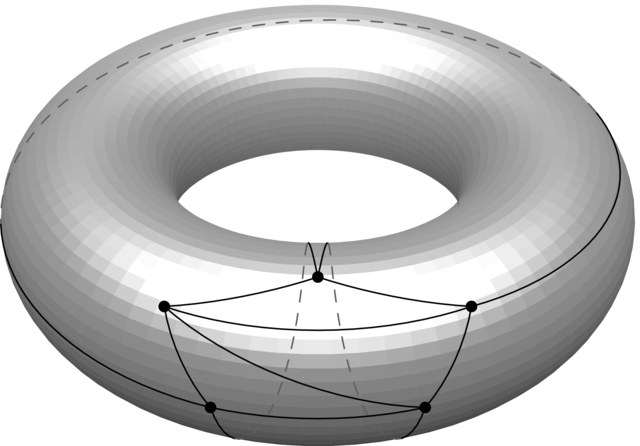
Pol Vanhaecke asked me if I was able to draw some graph on a torus. The problem is the following: in the plane, try to join 5 points with curves, each point being linked directly to every other point. What happens is that at least one curve intersects another one. This means that it is impossible to embed a complete graph with 5 edges in the plane. What is funny is that it is possible to do so in the torus as shown below. This picture has been made with the m3D programs, also it was one of the first time I attempted to draw curves on manifolds with them. Jian Qin asked me I still had the MetaPost code, and since the answser was maybe no, here some new one.
 |